What Is A Histogram In Photography
Hey there, fellow photographers! Have you ever heard of a histogram? No, it's not some fancy type of sandwich or a weird dance move. It's actually a really useful tool when it comes to taking great photos. What Is A Histogram In Photography - you might ask? Well, it's a graph that shows the distribution of brightness values in your image. Basically, it tells you whether your photo is overexposed, underexposed or just right. In this post, we're going to dive into histograms and how they can help you take your photography to the next level. Let's get started!
The Histogram Exposure Chart #PhotoshopForBeginnersArt
Tip #1: Know Your Camera's Histogram
Before we jump into the nitty-gritty of histograms, let's first talk about how to access it on your camera. Every camera is different, but generally, you can find the histogram display in your camera's playback mode. It's usually represented by a graph icon. Learn how to access and read your histogram and it will be your best friend in your photography journey.

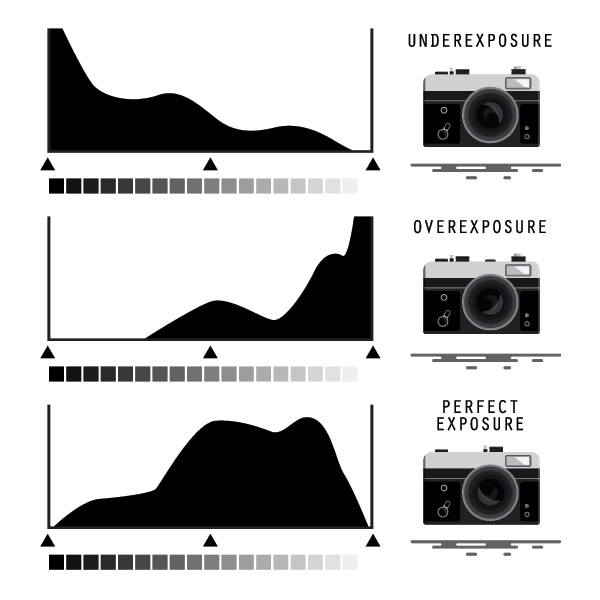
The histogram exposure chart is a great way to make sure that you're exposing your photos correctly. The chart shows various brightness levels from 0 to 255. The left side of the chart represents the shadows, the middle represents mid-tones, and the right side represents highlights. A well-exposed photo should have a histogram that looks like a bell curve with the majority of the graph in the middle range.
Cheat Sheet: How To Read A Histogram
Tip #2: Understand The Peaks And Valleys
Now that you know how to access your camera's histogram display, let's dive into how to read it. A histogram graph has peaks and valleys that represent the brightness levels of your image. A peak on the left side of the graph means that your image is underexposed, while a peak on the right side means that your photo is overexposed. Ideally, you want your peaks to be in the middle range of the graph for a well-exposed photo.

The key is to not have any peaks or valleys that go right off the edge of the graph, as this means that you're losing detail in your photo. If possible, try to adjust your settings so that your graph stays within the limits. This will ensure that your image has the maximum amount of detail possible.
How To Read Your Camera's Histogram
Tip #3: Expose To The Right
So, what's the trick to getting a well-exposed photo? Expose to the right! This means slightly overexposing your image so that the histogram peaks just before the right edge of the graph. This technique is called "exposing to the right" because it shifts the bulk of the graph towards the right side. It might sound counter-intuitive, but by doing this, you're forcing more information into the brighter part of the image, increasing the overall quality and detail.
Keep in mind that this technique doesn't work for every situation. It's best used in situations where the shadows are more important than the highlights, such as landscapes or portraits. If you're shooting something with a lot of highlights, you might want to expose to the left instead.
Well, there you have it, folks! You're now a histogram pro! Don't be afraid to experiment with your camera's settings and try out "exposing to the right." Your photography will thank you for it. Happy shooting!
View more articles about What Is A Histogram In Photography
Post a Comment for "What Is A Histogram In Photography"